Further Details of ERCOT's Load Growth
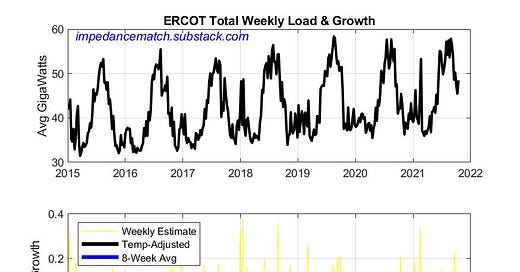
In a prior post1, ERCOT’s load growth was estimated from load and temperature data. The ISO’s total load growth for the past few years was estimated and plotted. The plots of the average load (in Giga-Watts) and load growth are also presented here.
Annual load growths are calculated on a weekly basis by taking the difference between the same week of data from the year prior (ending Fridays, so 364 days ago). The difference adjusted for differences in temperatures, and then dividing by the prior year’s load (also temperature-adjusted). Raw loads over the past 8 weeks have actually been 9.8% higher. When adjusting for temperatures, however, load growth is still a robust 4.8%.
In the second plot above, the raw (yellow) and adjusted (annualized) weekly load growth estimates (black) are shown. Without the temperature adjustment, one would think that winter storm Uri from last February would represent load growth of 25%. It was higher, but not by as much as expected given the cold temperatures, and the actual load was 27% below expectations from temperature considerations which is more appropriate, since load shedding was in effect. (Those values of +25% and -27% are from the weekly averages.)
Regional Growth
ERCOT reports loads over different zones. Here is a map of the weather zones made by ERCOT.
The following table shows the recent loads (weekly averaged) separated by region. Included are the raw load percentage differences and the temperature adjusted values.
Load growth has regional differences with the North, Far West and West regions all serious growing recently, but also, the South Central, East, and Coast regions have had robust growth. Of note is the lack of growth in the North Central region. Dallas and the surrounding region has lagged the rest of the state.
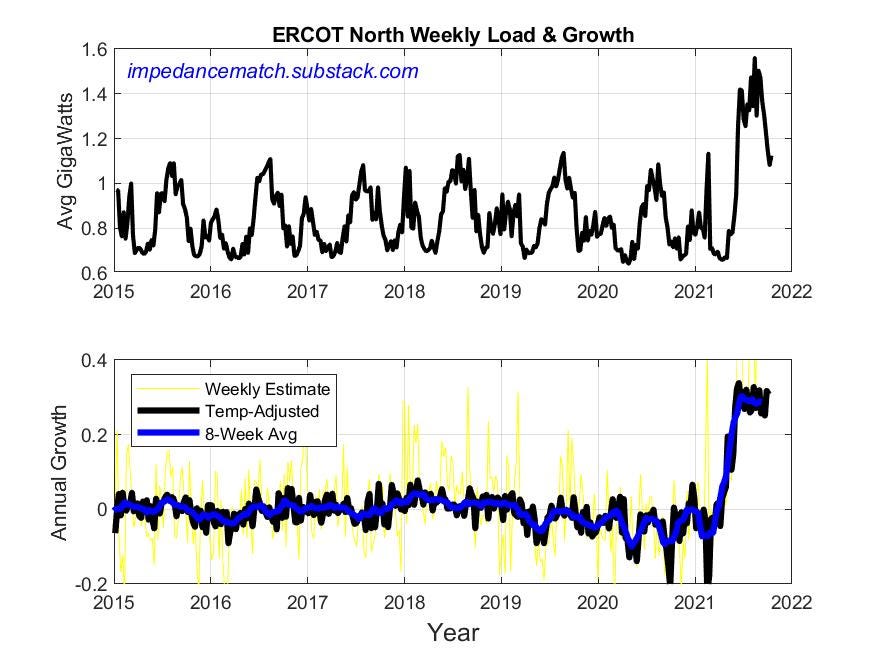
Here are two of the regional graphs.
North Region
The North region would appear on fire, but in reality, the load growth is because of the inclusion of Lubbock in ERCOT now.2 This does not represent new economic activity in Texas, but it does represent new load in ERCOT on the order of ~400 MW. Lubbock represents about 20% of the total ERCOT load increase this past summer.
Far West
The Far West region has been on fire for a few years now and is related to Midland oil. With oil and gas prices high and Covid waning (hopefully), the past growth may be ready to return.
Summary
After a difficult year, and in spite of a short but deep winter disruption and a small tropical-storm disruption this summer, ERCOT loads are growing strong. Modeling ERCOT loads long-term must take into account the increased load.
http://www.ercot.com/news/releases/show/232099


