While wind capacity has been the big story in ERCOT the past few years, the rise of solar capacity in ERCOT cannot go unnoticed, and solar is likely to take on a larger role in the near future. Solar and wind combined with battery storage has the ability to significantly change ERCOT’s power stack—even more than what wind has done already. Here the ERCOT solar and wind pipelines are presented. Batteries will be discussed in a later post.
Generation assets are compiled by ERCOT and also EIA. ERCOT is the primary source of course, but the EIA dataset is national and useful in larger analyses. EIA data are lagged by two to three months with the most recent data from May, 2021. ERCOT, in its GIS reports, gives information on asset additions and its data are up-to-date through July.
Solar Capacity
Using the EIA data for ERCOT, the following past, current, and projected solar capacity versus initial operation date plot is constructed. The capacity is the traditional nameplate capacity which is really the plant’s peak capacity. For the projected capacity, EIA seems to select those ERCOT projects that have an Interconnect Agreement (IA) and are considered Financially Secure.
The following plot gives the “secure” pipeline and includes ERCOT’s posted actual solar data (hourly and weekly average). Peak hourly data-to-date is 6,920 MW which occurred on 3-Aug-2021 and average power in recent weeks has been near or above 2.5 GW.

What is clear from the graph is that solar is just getting started, and while capacity has doubled in the past year, and EIA expects installed solar capacity to triple by 2024. This suggests peak power near 17 GW during mid-morning to early afternoon on clear summer days two summers from now, and average weekly power above 7 GW or roughly 12% of weekly averaged load at summer peak—also a tripling of the 4-5% of load supplied by solar presently.
Wind Capacity
ERCOT wind capacity is still on the climb as shown in the next plot along with the actual wind supplied since 2007. Maximum hourly power occurred on 26-Jun-2021 at 23.4 GW. Capacity is projected to rise another 40% over the next two years. With current weekly wind power averaging near 10 GW, the projection is that during the summer months, solar and wind combined in the amount of ~20 GW (time-averaged) a couple years from now.
ERCOT vs. EIA Capacity Projections
It is reasonable to ask whether or not the projections are themselves reasonable. Is this much renewable generation really going to be built!? The informed answer appears to be “yes” because EIA lists only those projects that are deep into the pipeline, having completed all feasibility studies and having financial backing. However, there are even more projects that are in earlier phases which can be found in ERCOT’s monthly GIS reports.
In their GUIDE TO THE INTERCONNECTION PROCESS1, ERCOT maps out the details of how to get your electric plant up and running. It is important here to state that I have never been involved with the process, and all I’ve done is RTFM. There are many details to this process described in the manual that will be skipped over here. Here is a highly abridged version of the interconnection process:
Registration and GINR (Generation Interconnect Request Number) assignment
Screening Study
Full Interconnect Study
Interconnection Agreement
Project Funded and Built (some details skipped here)
Request for Energization
Request for Synchronization
Commercial Operation
In this process, EIA selects those projects that have completed the full study, the interconnection agreement and for which the owners have posted full financial commitment. This is relatively deep into the process, so it is possible to get more light on the pipeline by looking at the monthly ERCOT GIS report(s) to see the amount of capacity in the earlier stages. Not all of these will make it through the process, but the trend contains useful information.
Full Solar Pipeline
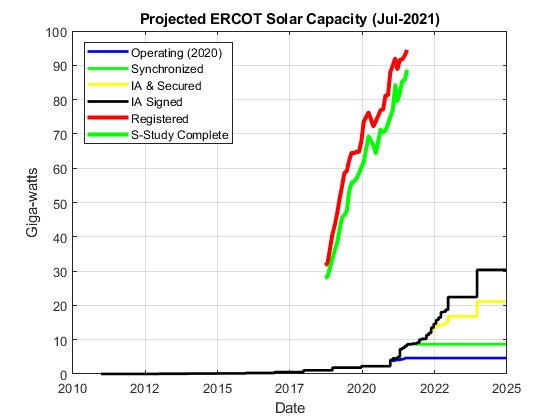
Among other items, the ERCOT GIS report contains the amount of capacity currently installed, currently synchronized are tabulated and shown as the lower 2 lines in the graph below for solar installs. While being “synchronized” doesn’t necessarily mean in commercial operation, in practical considerations, the amount of actual solar dispatched tends to lie near that lower green line.
The yellow line in the plot above shows the pipeline of projects that have completed the full interconnect study, have signed the interconnection agreement and have posted financial capability. In short, this is essentially the EIA quoted capacity installed and in the pipeline. The black line shows the amount of projected capacity that have an interconnection agreement and includes those that have not posted financial capability. All lines in the lower portion of the graph are plotted at the estimated commercial operation date.
The upper two lines show potential capacity that are in the earlier stages. There isn’t a projected commercial operation date for these projects, so they are plotted by the date of the GIS report. The two lines show those that are registered and active and then those that have completed the screening study and a full interconnection study is underway. The two lines do not include the current solar capacity in commercial operation.
The take-away from the plot is that ~30 GW of total solar capacity is projected by 2025 and another 70-75 GW (94 GW pipeline - 20 GW to be installed) or thereabout is in the early stages of development.
Full Wind Pipeline
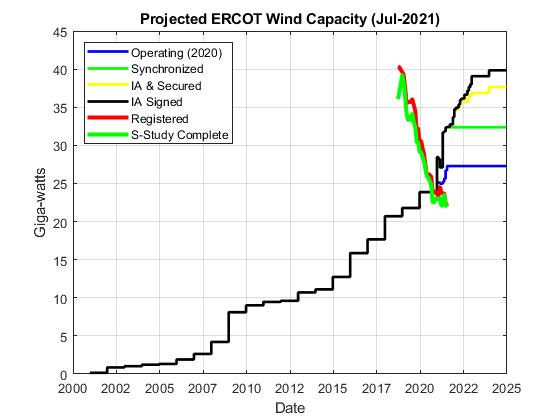
The same plot can be made for wind and is given below. As of last year, 27 GW of capacity was installed with 32 GW synchronized now (and the bulk of which appears available for dispatch), plus another 5-8 GW expected by 2025.
The amount of wind capacity in the early pipeline days has been declining, but there is a good 10-15 GW that is still in the study phase.
Power Supplied or Curtailed?
While beyond the scope of this note, it is worth asking if the new solar and wind will be delivered or curtailed, or perhaps the better targeted question is how much will be curtailed? The answer isn’t zero, because there are times currently, particularly in the swing months when demand is low, the wind is blowing, and the sun is shining. When this happens, prices go to zero or negative and power is left stranded in ERCOT. A detailed answer to the question of how much requires a discussion of the current and projected storage (battery) capacity.
If it is assumed that the electric storage increases, then it is worthy to consider the longer-term average. As noted above, for solar, it is almost a given that the projected fractional amount of power delivered will be around 12% of summer loads in a couple of years and for wind, 14% is a good number. The two renewables are also incredibly complementary as the sun shines during the day while on any given day, the wind tends to be near its minimum in the middle of the day. Still, the combination of these two gives only about a quarter of the energy required to meet the load.
With some electric storage, there is plenty of room still for further renewable penetration. Indeed, without storage, a large portion of those projects in the early days of development will fall to the wayside.
The next (non-daily) post will look at the battery pipeline.
“Guide to the Interconnection Process” is available at www.ercot.com.


