Wind Power Capacity Factors

To forward-model wind-produced electric power beyond short-term weather forecasts, a key number is the wind capacity factor. The capacity factor is the ratio of the actual amount of actual power production and the asset nameplate capacity (the peak power output). Here we concentrate on ERCOT’s wind capacity factor and then present this factor for other CONUS regions.
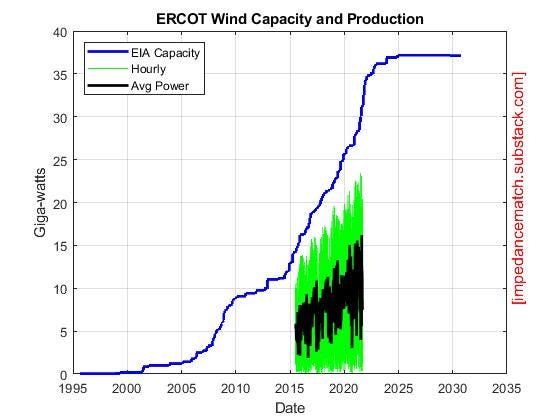
ERCOT Wind Capacity
ERCOT’s wind assets have been and continue to grow as shown in the following plot. The plot shows the wind capacity versus time from the EIA data-set along with a projection forward of the expected capacity for projects deep into development. The light green line plots the ERCOT posted hourly wind production, while the black line in the middle is the produced power averaged on a weekly basis.
There are more data available, but we have only used data from mid-2015 to present, so just over 6 years. It turns out, this was a good choice to compare to another analysis presented below.
The observed capacity factor is found by dividing values from the black line by the the values from the blue line in the above figure. Here are the capacity factors for the 6 years of data plotted against the day of the year.
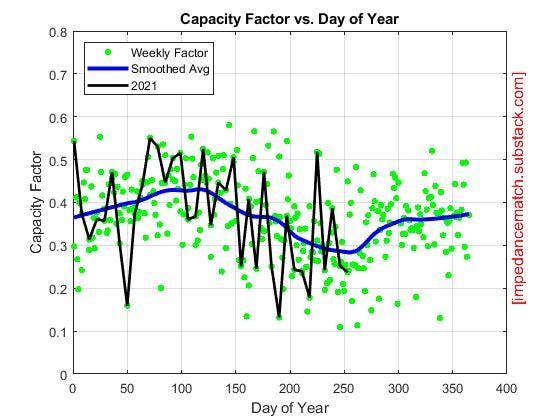
There are many items to unpack from the above figure. The ERCOT wind capacity factor is 0.36 averaged over the 6 years of data. The capacity varies by season, peaking in the spring (Day 100 = 10-Apr) on average at 0.43 and is a minimum in late summer (Day 250 = 7-Sep), with an average value of 0.28. The blue line shows the smoothed average capacity factor seasonally.
On a week-to-week basis, there is some serious variation in the wind capacity. Without a seasonal correction, i.e. using the raw capacity factors, the variation is about 0.096 or about 26% of the mean value. With the seasonal correction removed, the variation reduces to about 0.085 or about 23% of the value of 0.36.
The solid black line in the figure above connects the capacity factors for 2021. Note the dip at Day 50. This was winter storm Uri when a good portion of the wind assets had trouble which brings into question the difference between the intrinsic (weather) fluctuations and the actual (instrument variation included) fluctuations.
National Wind Capacity Factors
Once this analysis above had been done, it made sense to see what other analyses have found. Wouldn’t you know it, the Energy Information Administration (EIA) has been here before. On 15-Feb-2015, EIA’s Today In Energy post presented the wind capacity factors for different CONUS regions and showed the variation over the year. Here are their plots.
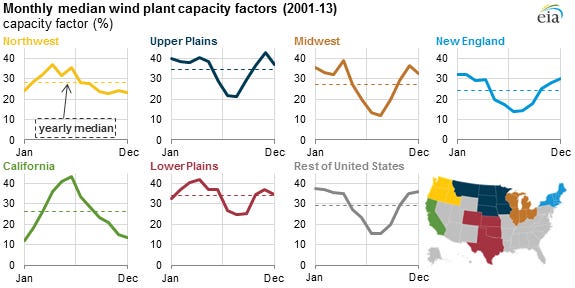
My analysis focused on ERCOT and used ERCOT asset data and hourly ERCOT wind production data pulled from the ERCOT website. EIA’s analysis, done primarily by Fred Mayes, used the EIA asset dataset known as EIA-860, and the monthly plant generation dataset known as EIA-923. My dataset hasn’t any overlap with the EIA data, mainly because they used earlier years.
The EIA “Lower Plains” data agree in the medians with the analysis here. Because the periods of operation are different, we have a good indicator that the described model is good to use for far-forward estimates. In other words, the capacity factors appear stable year-to-year.
There are some great observations from the EIA data. California bucks the rest of the nation with peak wind power coming near the end of May and minimum power is in the winter. The Northwest is similar to California, but that region has a higher winter capacity factor. East of the Rockies, wind power peaks in the spring, but power is higher in the fall compared to the West.
Summary
Wind capacity factors can vary by season and by region. There are also daily and weekly variations, of course, that tend to dominate how much wind-produced power is actually made for any given day or week. Our ERCOT value from hourly data agrees with the EIA value made independently from earlier monthly data.