ERCOT Weekly 31-Jul-2023
Record loads this week. Near record solar and natural gas electric generation also.

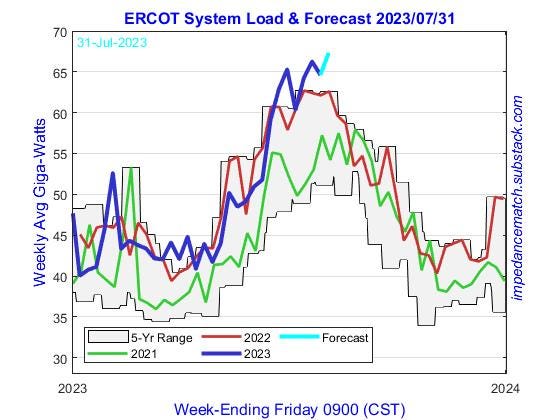
Weekly Average Load
This week’s system average power load expectation is 67.40 GW (ending Friday 4-Aug at 15 UT) compared to 64.62 GW last week (ending 28-Jul, and our forecast was 65.23 GW a week ago for last week). Weekly-averaged power was above the upper portion of the 5-year band. The weekly load record is 66.26 GW set two weeks ago.
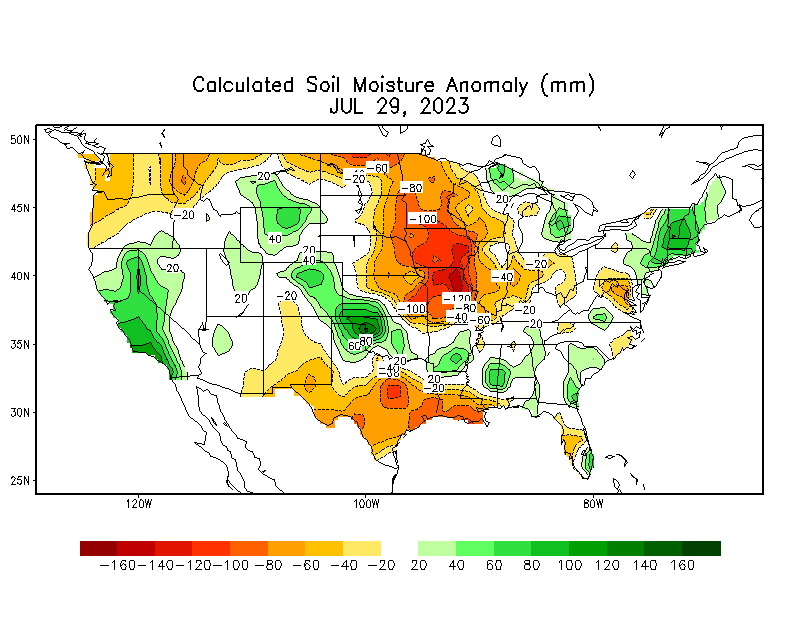
Soil moisture deficit increased last week in South Texas according to the CPC with more deficit areas clearly present.
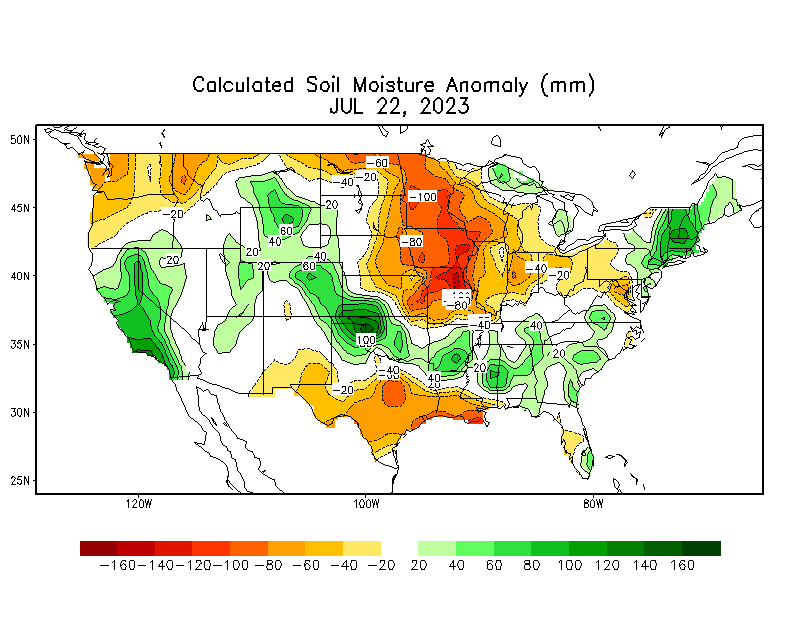
Here is CPC’s plot from the week before.
Generation
Here is today’s daily table with load and generation averages. This table is generated daily and part of ERCOT Daily.
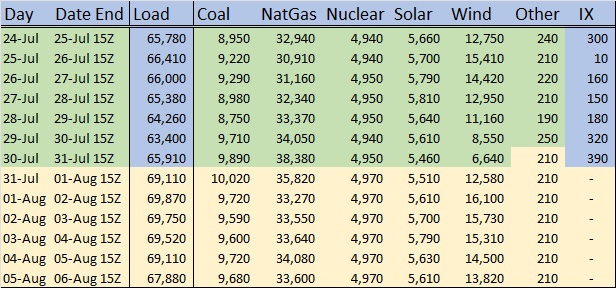
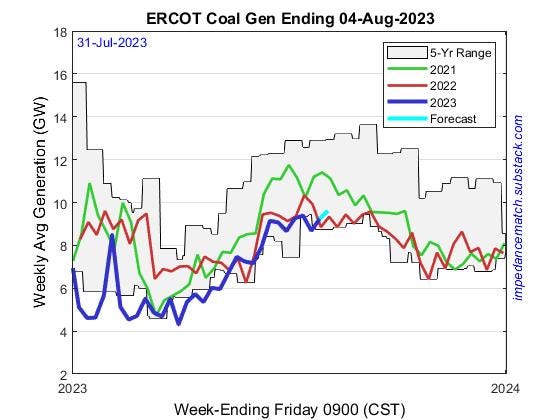
We are estimating 9.61 GW average coal power generation this week (ending 4-Aug). Last week came in at 9.24 GW versus our forecast of 9.71 GW. Coal power production is likely to stay near or below the 5-year band this week. It cannot get much higher during the day due to the limited number of coal plants, and coal usually goes lower at night with the lower load and cheaper wind.
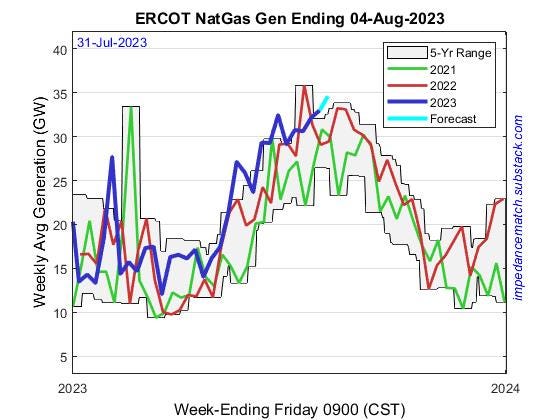
Natural gas power generation last week was 32.97 GW on average (ending 28-Jul morning) versus our estimate of 33.20 GW. This week, our estimate is 34.58 GW (ending 4-Aug). Gas usage is near record levels.
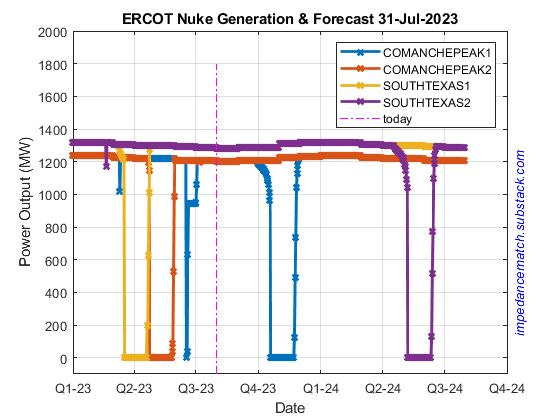
Nuclear generation is expected to be 4.96 GW, versus 4.94 GW last week. All four reactors are operating at 100% at time of posting.
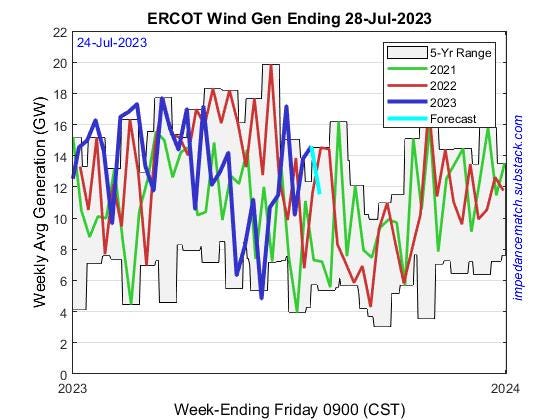
Wind production last week was 11.41 GW (ending 28-Jul 15 UT) versus 11.53 GW forecasted. This week, the expectation is lower at 12.30 GW (ending 4-Aug 15 UT), under the upper bound of the 5-year band.
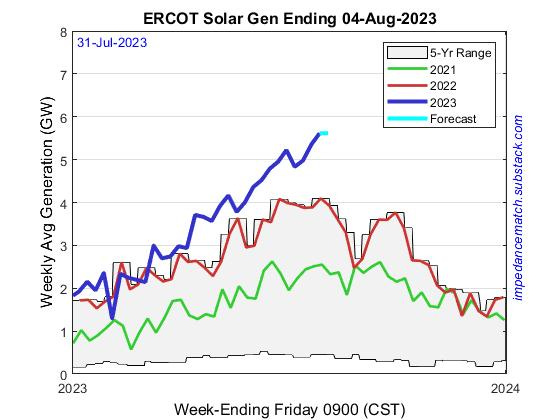
Solar production averaged 5.61 GW last week (ending 28-Jul 15UT) versus our forecast of 5.48 GW a week ago. This is a new reekly average record beating the week before (5.35 GW). This week, 24-hour averaged solar electric production is estimated to be 5.62 GW—at or above last week’s record.
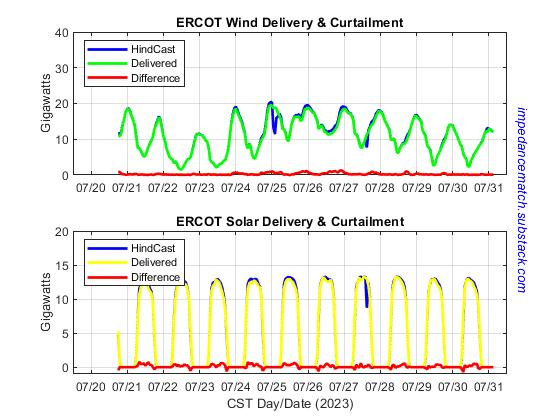
Here is a plot of wind and solar delivered and forecasted resources for the last 10 days. The difference is a curtailment estimate (in red). Values are given daily in our ERCOT Daily report.
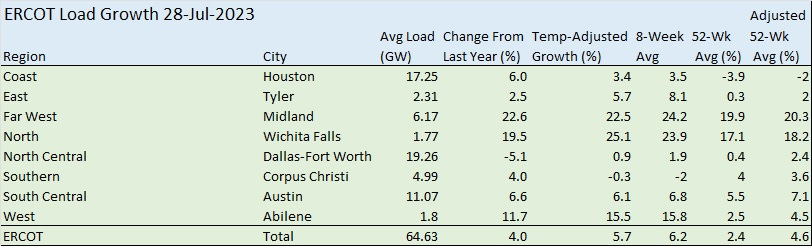
ERCOT Load Growth
Weekly loads and estimated load growth for all of ERCOT are strong.
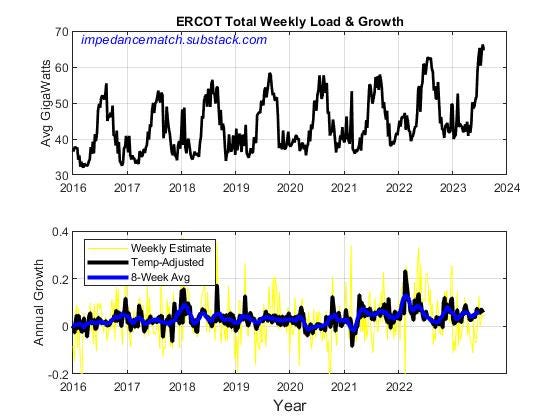
Last week, load was up by 4.0 % y-o-y. On a temperature adjusted basis, loads were up 5.7 %, a similar rise to last week’s 6.2% . The 8-week average of load growth is 6.2% (compare to 6.0% last week) with most of the gains in the Far West and North regions. The West region is also growing at a double-digit pace. Major population centers (Coast and North Central, and Southern) have not been growing or only growing slowly.
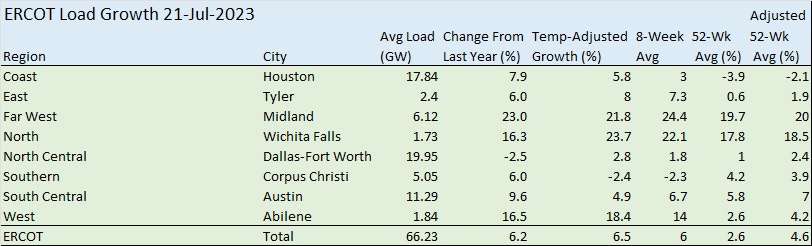
Here is last week’s table for comparison.
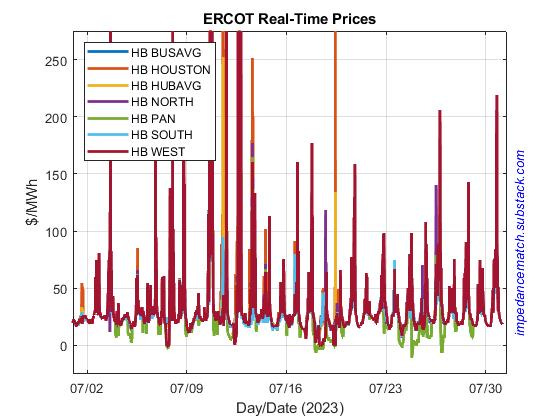
Real-Time Prices
Real-time prices wereagain less volatile last week despite the warm weather. Of notice were 24-26 Jul when prices went to zero in the Panhandle. Day-Ahead are elevated for today due to the loads and less wind.