

ERCOT Weekly 14-Jul-2025
Record storage draw last week. Solar strong this week.

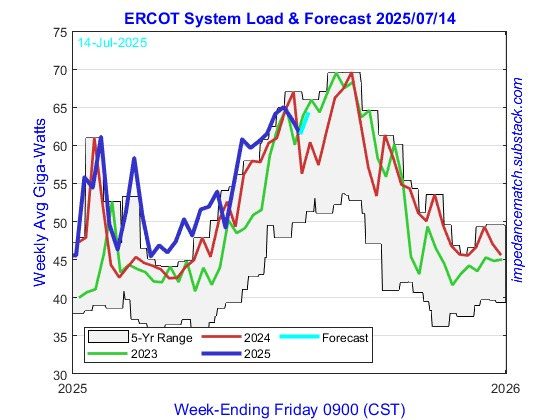
Weekly Average Load
This week’s system average power load expectation is 64.23 GW (ending Friday 18-Jul at 15 UT) compared to 61.46 GW last week and expectation of 61.30 GW. Load was below the 5-year upper band last week and this week’s expected power is again under the upper band.
Impedance Match is a reader-supported publication. To receive new posts and support my work, consider becoming a free or paid subscriber.
Generation
The weekly table containing weekly average power and generation as of today is here.
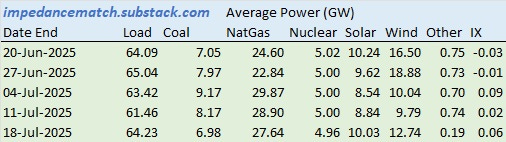
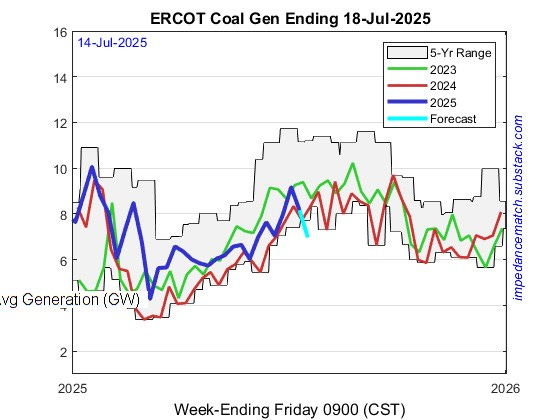
We were estimating 6.98 GW average coal power generation this week (ending 18-Jul). Last week came in at 8.17 versus our estimate of 7.88 GW. Our estimate will likely come up some as the actuals come in.
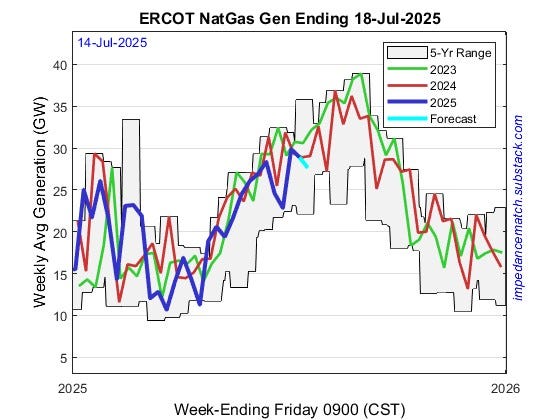
This week, our estimate for natural gas fueled power generation is 27.64 GW (ending 18-Jul). Natural gas power generation last week was 28.90 GW versus 26.28 GW estimated.
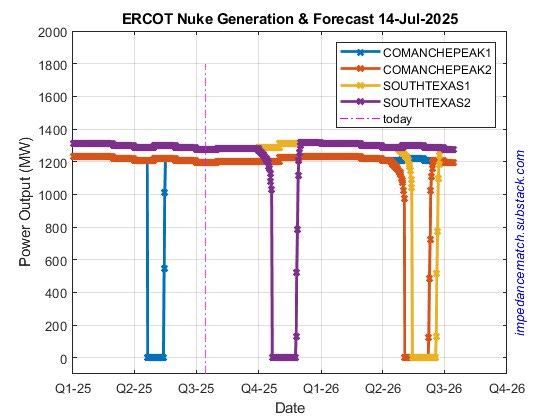
Nuclear generation is expected to be 5.00 GW with all four units at 100%.
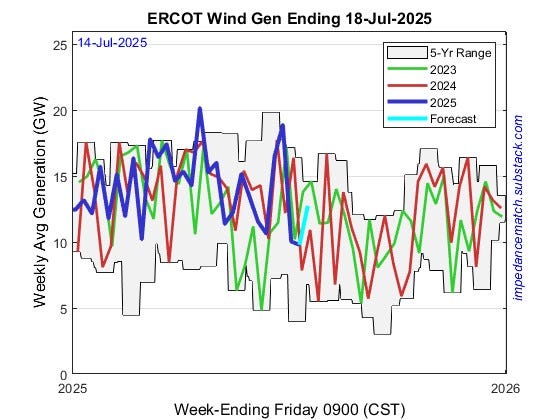
Wind production last week was 9.79 GW (ending 11-Jul 15 UT) in the upper portion of the 5-year band and versus our estimate of 10.89 GW. This week, the expectation is much lower at 12.74 GW (ending 18-Jul 15 UT), in the middle portion of the 5-year band.
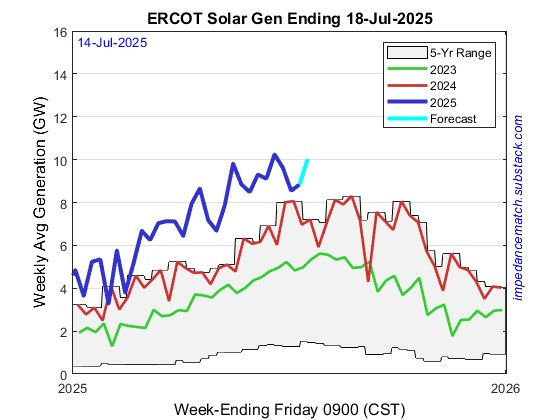
Solar production over a weekly average was 8.84 GW last week (ending 11-Jul 15UT), above the expectation of 9.47 GW. The 24-hour averaged solar electric production is estimated to be 10.03 GW for the current week.
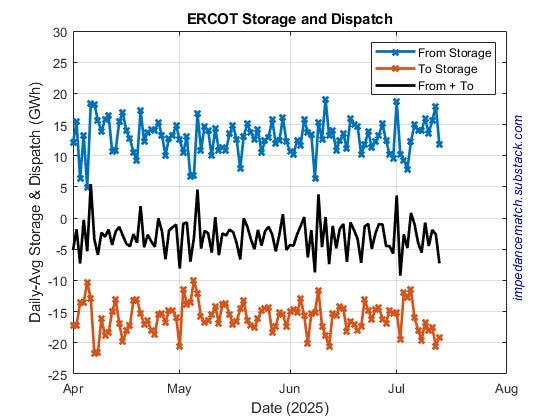
Daily storage continues to be strong with dispatch mainly above 10 GWh for most of the year. Daily dispatch has averaged 12.9 GWh compared to 15.8 GWh intake into storage. The storage cost is 18.2% of intake energy. Last Friday, a new maximum 5-minute discharge from storage of 6,217 MW was set, beating 5,925 MW from 10-Apr.
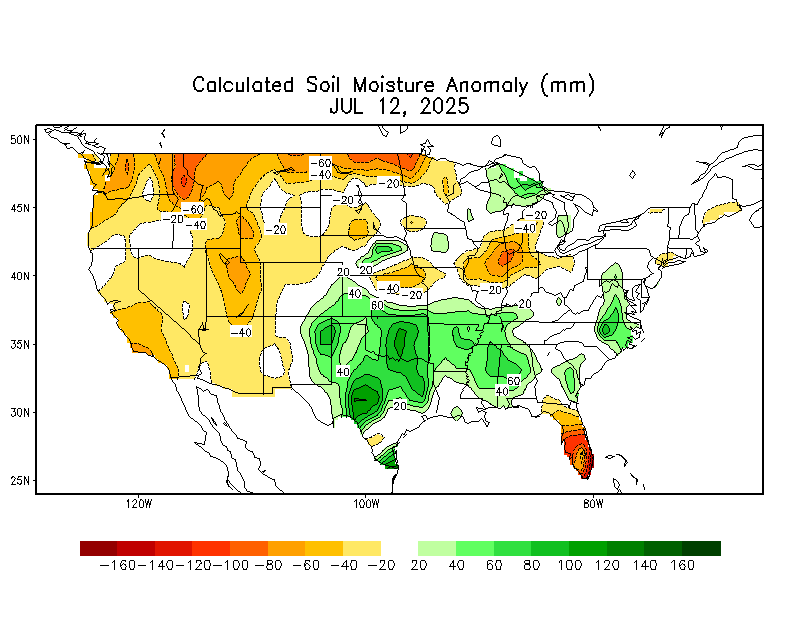
Texas is now in a surplus of soil moisture. This will help keep a lid on prices even as the rain exits.
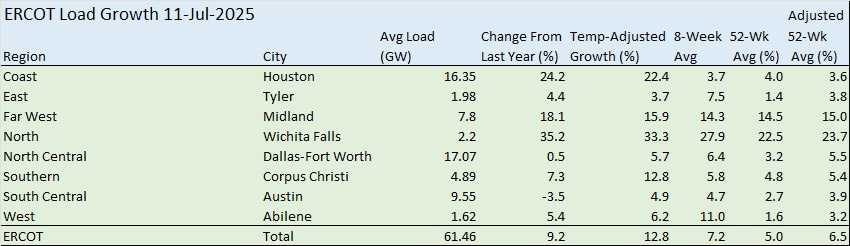
ERCOT Load Growth
Weekly averaged load was down 9.2% from last year compared to up 5.4% last week. Last week, on a temperature adjusted basis, y-o-y load growth was up 12.8% versus last week’s value of 9.5%. Averaged over 8 weeks, the growth is 7.2%, higher than last week’s estimate of 6.1%. The two areas that stand out for high growth are the Far West and the North.
The weekly load and growth is shown for ERCOT in the plot below. Growth continues.
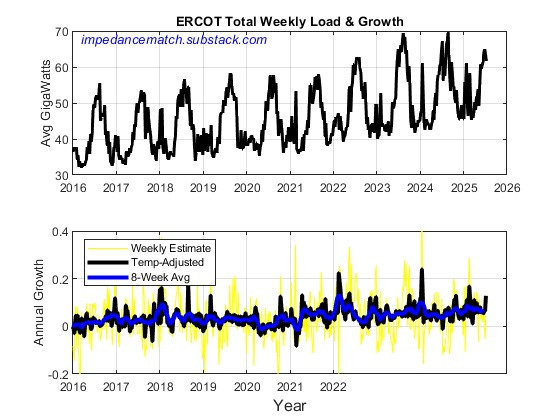
Top plot is the weekly average power. Bottom plot is the y-o-y load difference with yellow being the raw difference, black being the temperature adjusted and blue being the 8-week average of the temperature adjusted.
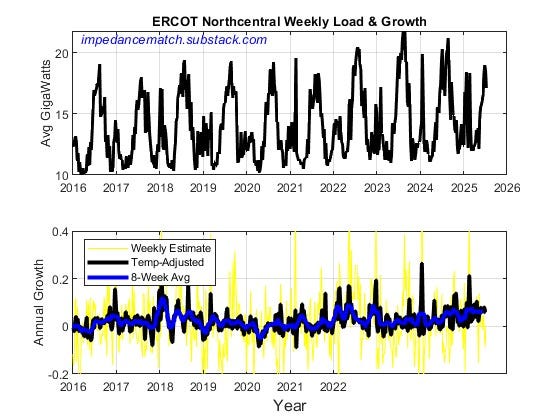
Here is the same plot for the North Central Zone which includes the Dallas-Fort Work metroplex. The growth has picked up recently. (Last week the North Zone was plotted.)
Real-Time Prices
Median System Hub price was $26.31/MWh last week, higher than $29.07 the week before. The mean price was $34.44/MWh, high price was $1,754/MWh and minimum hub price was $10.87/MWh
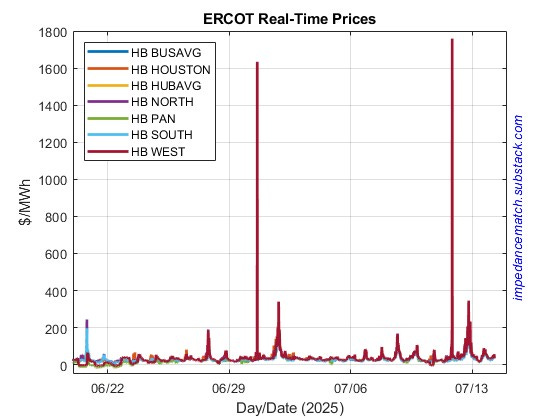
Max price in the West Zone was $1,758.6/MWh and median was $ 29.92/MWh.