


Load and Load Forecast
Peak hourly load yesterday was 79,697 MW, 0.4% lower than yesterday’s forecast of 80,000 MW. Peak load was just below the upper band of the trailing 5-year maximum load range. The daily minimum load (morning) was above the upper band of the 5-year minimum load range. (The ranges average over 5 years and one week either side.)
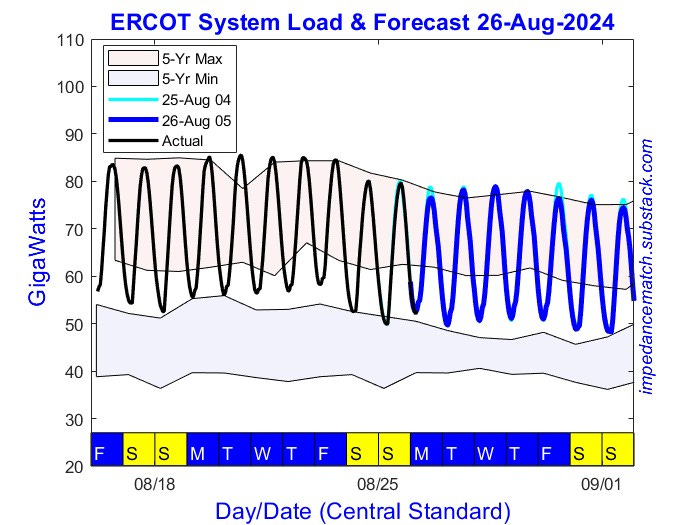
The average daily load for yesterday was 65,310 MW. Friday’s forecast was 63,360 MW. See the table below for the forward daily estimates.
ERCOT’s peak load forecast for today is lower at 76,600 MW. The forecast for tomorrow is at 78,200 MW. Record load is 85,559 MW from 20-Aug-2024.
For weekly averages this week ending this coming Friday 30-Aug 15Z, the average power is estimated to be 65.02 GW. The verification for last week ending last Friday 16-Aug 15Z was 69.97 GW and 67.74 GW the week before. Last week’s value is a new weekly average load record, beating 69.51 GW from the week ending 11-Aug-2023.
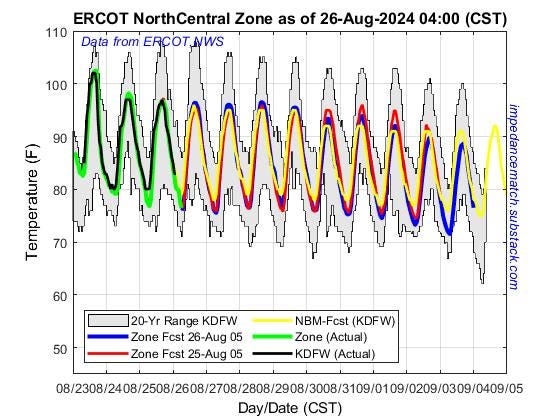
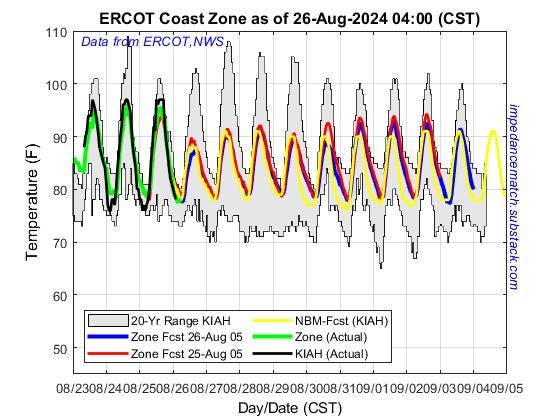
Weather
North Texas temperatures went lower over the weekend and will continue lower this week.
Coastal Texas temperatures move lower today with rain expected in South Texas for most of the week.
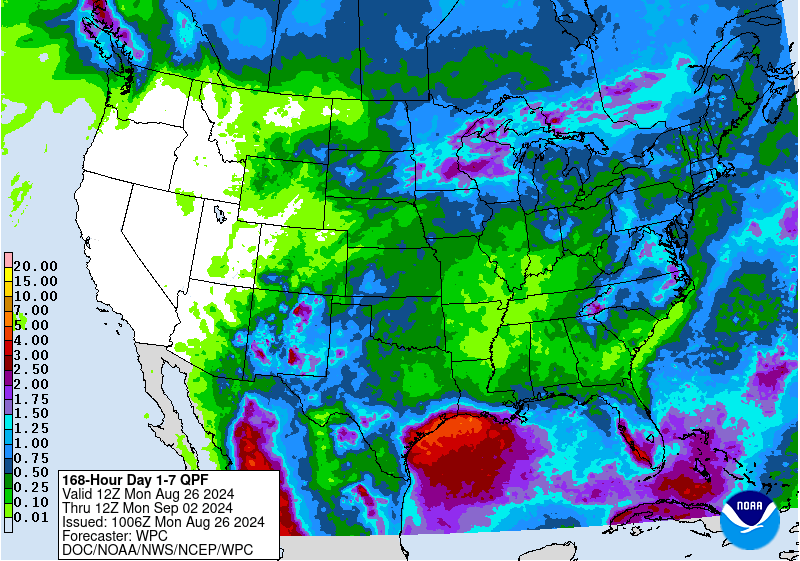
The NOAA 7-Day QPF has rain most days, mainly in South Texas. The Coast forecast is very wet and this is usually seen with tropical systems, but there isn’t any storm during this time period.
Generation
Wind supply is moving to low levels this week and very low levels near the end of the forecast.
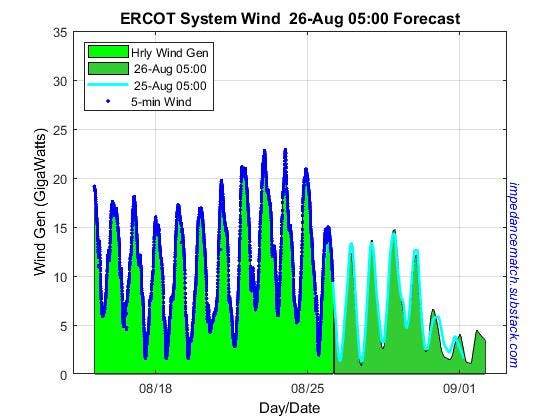
This week ending this coming Friday (30-Aug 15Z) the average wind power forecast is 9.09 GW, lower than last week (ending Friday 23-Aug 15Z) which was 11.06 GW. The week prior was 13.79 GW.
Solar supply moves lower today. Record hourly solar was on Tuesday (20-Aug) at 20,647 MW with the maximum this past weekend of 20,321 MW. This does not include the amount shunted directly to storage. Cloudier skies this week.
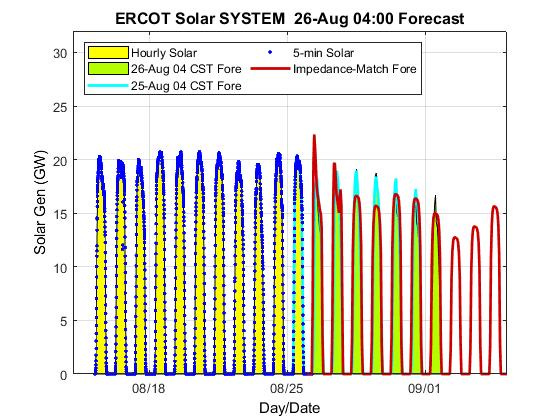
This week’s forecast (ending this Friday 30-Aug 15Z) is a 24-hour average solar power of 7.20 GW, lower than last week’s 8.30 GW (ending 23-Aug). Dispatch was 7.91 GW the week before that. Red line in the forecast is our model.
Our estimates for the wind and solar models vs dispatch differences for Friday-Sunday 23-25 Aug are
Keep reading with a 7-day free trial
Subscribe to Impedance Match to keep reading this post and get 7 days of free access to the full post archives.