ERCOT publishes generation pipeline data monthly, and our last was about a month ago. This is from the latest files that posted on or before 7-Dec-2022. Most of this post has the same language as prior capacity updates. The primary changes are the newer figures.
We divide the data into two different groups: (1) projects deep into the pipeline and (2) projects in the early development phase. The ones deeper in the pipeline are taken by EIA for their estimate of generation capacity, and the EIA numbers generally agree with these ERCOT numbers with some minor timing issues of when the data are reported.
Pipeline Milestones
When segmenting the data, it is important to know the different milestones in the generation pipeline. An abridged version of the interconnection process is as follows:
Registration and GINR (Generation Interconnect Request Number) assignment
Screening Study
Full Interconnect Study
Interconnection Agreement
Project Funded and Built (some details skipped here)
Request for Energization
Request for Synchronization
Commercial Operation
Deep In Pipeline Projects
For those projects further along in the development phase, ERCOT reports data at three main points. All projects here have passed some basic screening tests as well as the more rigorous Interconnection Study. The first is the amount in commercial operation and synchronized and callable (i.e. they are out of the pipeline). The second bucket is those projects that have Interconnection Agreements (IA) and have posted financial security. The third group are those that have an IA in place but have not demonstrated financial security to ERCOT. All projects have passed the all-important Full Interconnect Study phase.
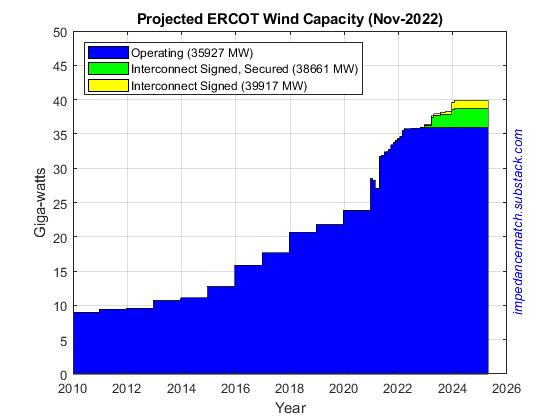
Here is the wind (nameplate) capacity with projections to the end of 2024.
There is 35.9 GW of wind assets currently operating. More is being built with the projection to be 38.7 GW by the end of 2024, down 1.9 GW from October.
On a time averaged basis, it is important to remember that wind has a capacity factor of about 35%, so 40 GW of wind assets—fully dispatched—yields about 14 GW DC.
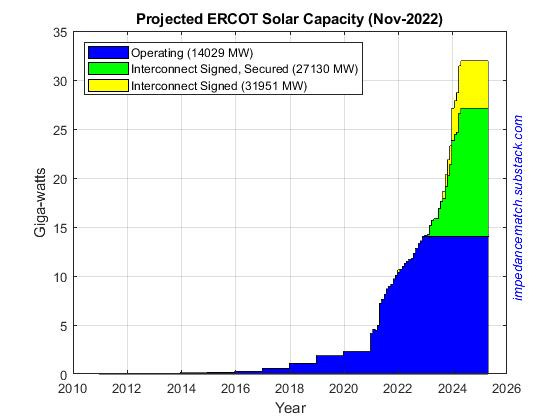
Solar currently has a capacity of 14.0 GW. Hourly solar dispatch broke the 10 GW barrier on1-Oct-2022 with maximum 10,039 MW. If the skies clear, this could be taken out early next year with the newer capacity online.
The number expected by the end of 2024 is now at 31.9 GW if all deep-in-the-pipeline projects are finished by that time.
With the wind and solar supply curtailed due to transmission and other constraints, the market continues to signal that the way forward is with increased energy storage capacity, primarily in the form of battery banks.
Battery capacity (operating and synchronized) is now at 2.79 GW. The projected capacity growing to 8.7 GW projected by the end of 2024, down slightly from October.
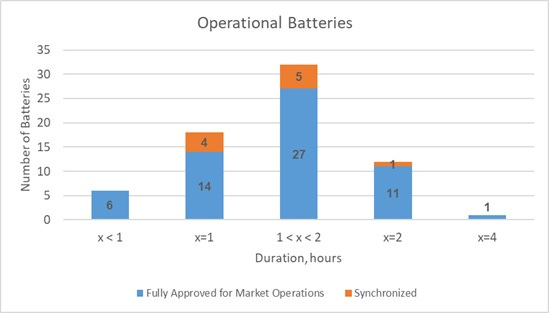
Battery capacity is quoted in MW which means it is the amount of power deliverable and not the amount in storage which would be in MWh. ERCOT provides modest information on the amount of storage. Here is a plot of the Duration for the batteries installed presently from ERCOT’s battery co-location data. This plot is from the October, 2022 report, but there is little change.
What the plot means is that most of the installations have less than 2 hours duration at capacity. So, 2.6 GW of capacity is only for 1 to 2 hours, and that is all. Assuming 2 hours, then dividing the capacity by 10 and a little, one can get a good idea of the 24-hour capacity. In other words, today’s 2.6 GW is only good for 260 MW if on a 24-hour period.
Given the solar and wind daily patterns, really about 3 hours of battery additions is most useful between when the Sun goes down and when the overnight wind ticks up. In that case, there is about 1 GW of capacity to smooth out the solar-wind transitions.
Early Stage Projects
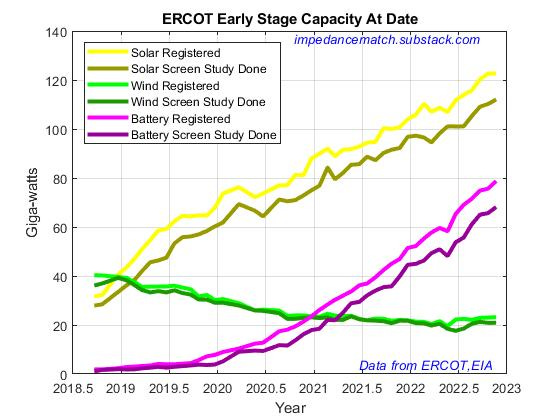
The early-stage pipeline is still looking robust. ERCOT tracks projects at different points in the early stages, but here we will concentrate only on two of those numbers. The first is the amount of assets registered which is the initial step towards commercial operation. The second is the amount that have passed an initial screening study.
Here the early stage capacity is plotted for the two initial stages for solar, wind, and batteries. Solar projects in the early pipeline stage now total 122.7 GW, up 16.8 GW from January and up 6.9 GW from August. Battery projects are at 78.7 GW, up 26.3 GW from last January and up 7.1 GW from August. Wind is at 23.2 GW, up 1.1 GW from August. These are on top of the assets already in place.
Early stage wind projects have clearly stalled. Still, 20 GW of more wind would be game-changing by itself. Solar and battery intentions have both continued to increase.


